Image Details
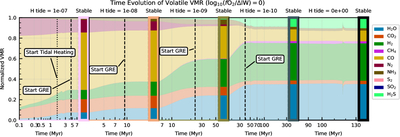
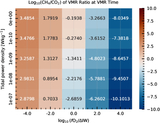
Caption: Figure 2.
Simulated atmospheric compositions (expressed as normalized volume mixing ratio, VMR) for cases with nominal elemental abundances and fO2 = ΔIW + 0, across all considered tidal power densities (see Section 2.3). The horizontal axis denotes the time after model initialization. The horizontal axis represents five axes stitched together, each leading up to their corresponding tV MR (Figure 1(B)), and for the case Htide = 0, the time of solidification. Cases transition smoothly across this plot because they all attain similar compositions in their evolution, only deviating from the case without tidal heating when tides maintain specific nonzero melt fractions corresponding to Htide. Weaker tides become active later, and so while these cases attain similar compositions as their stronger tidally heated counterparts, the time at which they do so varies. The dotted vertical lines in the shaded region represent the start of GRE epochs, demonstrating that the atmosphere composition remains unchanged in the absence of escape processes.
Other Images in This Article
Copyright and Terms & Conditions
© 2026. The Author(s). Published by the American Astronomical Society.