Image Details
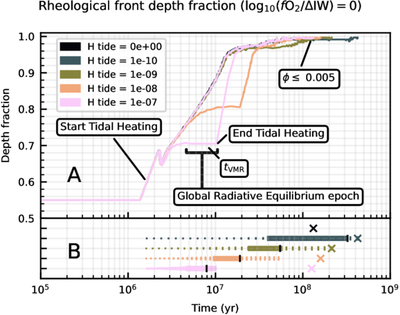
Caption: Figure 1.
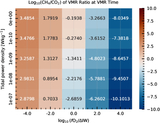
Simulation results for nominal abundance and fO2 = ΔIW + 0 across all tidal power densities (see Section 2.3). The horizontal axis shows time [yr] since the Moon-forming impact on a logarithmic scale. Panel (A): evolution of the rheological front (vertical axis: mantle depth fraction). Panel (B): evolution of tidal dissipation for each case (vertical axis: cases). Dotted lines trace cumulative tidal energy dissipation; marker size scales with total dissipated energy. Solid lines indicate tidal heat-supported GRE. Black markers (∣) denote the time tV MR at which we extract the volume mixing ratio for plotting in Figure 2. Note that the particular choice of tV MR is arbitrary so long as it lies within the temporal range of GRE, indicated by the solid lines in the bottom panel. Crosses (×) mark mantle solidification (ϕ < 0.005).
Other Images in This Article
Copyright and Terms & Conditions
© 2026. The Author(s). Published by the American Astronomical Society.