Image Details
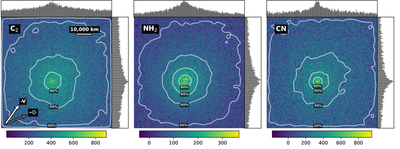
Caption: Figure 8.
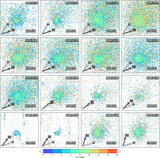
Relative spatial distribution of the C2, NH2, and CN gas using maps coadded from 2019 December 5 and 6 (7 × 600 s exposures). The histogram above/beside each map shows the sum of flux from a horizontal/vertical strip 10 pixels wide (a projected distance of 2900 km) through the comet center. All images are displayed with a linear stretch over a zmax scale and the same orientation as Figure 4. The contours are 20% flux intervals of the gas maps after smoothing by a 5 standard deviation Gaussian convolution. The 20% flux line of C2 is not labeled to avoid crowding. All images are 48″ (∼70,000 km at the distance of 2I) wide with a scale length of 1″ = 1460 km.
Other Images in This Article
Show More
Copyright and Terms & Conditions
© 2026. The Author(s). Published by the American Astronomical Society.