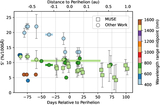
Image Details
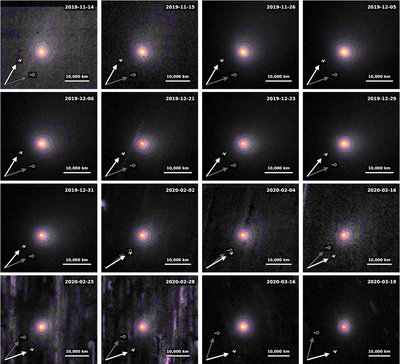
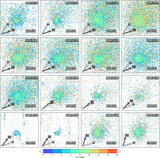
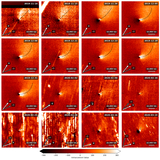
Caption: Figure 6.
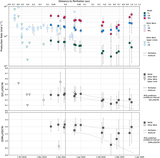
Dust emission maps spanning 2019 November 14 until 2020 March 19 displayed with a linear stretch and the same orientation as Figure 4. Streak effects are due to background stars (minimized by the application of starkiller). The contours (also fitted to the background stars and the edge of the FOV) at 9% intervals show the elongation of the dust in the coma in relation to the antisolar (-⊙) and negative velocity (−V) directions.
Other Images in This Article
Show More
Copyright and Terms & Conditions
© 2026. The Author(s). Published by the American Astronomical Society.
Copyright ©
2026 Astronomy Image Explorer. All Rights Reserved.