Image Details
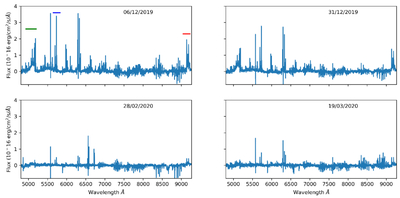
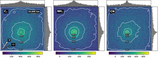
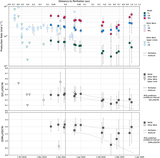
Caption: Figure 3.
Dust-subtracted spectra of 2I at four different dates, extracted within a 5000 km radius, over the wavelength range captured by MUSE and displayed in Angstroms (Å). The C2, NH2, and CN bands used to measure production rates are indicated by the green, blue, and red lines, respectively.
Other Images in This Article
Show More
Copyright and Terms & Conditions
© 2026. The Author(s). Published by the American Astronomical Society.
Copyright ©
2026 Astronomy Image Explorer. All Rights Reserved.