Image Details
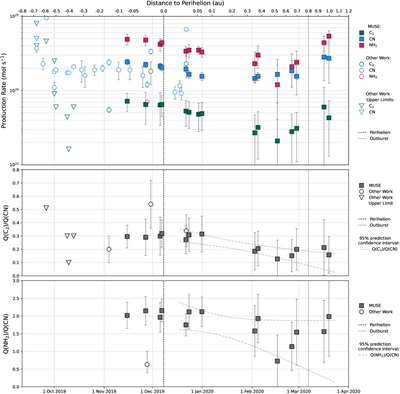
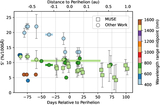
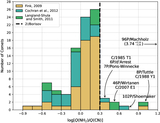
Caption: Figure 9.
C2, NH2, CN production rates (upper figure), Q(C2)/Q(CN) ratio (middle figure), and Q(NH2)/Q(CN) ratio (lower figure) for 2I from 20 September 2019 to 19 March 2020. Our measurements are shown next to other sources: A. Fitzsimmons et al. (2019), J. de León et al. (2019), T. Kareta et al. (2020), C. Opitom et al. (2019b), H. W. Lin et al. (2020), M. T. Bannister et al. (2020), K. Aravind et al. (2021), M. A. Cordiner et al. (2020), G. P. Prodan et al. (2024). Note that the measurements of Q(C2)/Q(CN) < 1 on 2019 September 20 (A. Fitzsimmons et al. 2019) and Q(C2)/Q(CN) < 2.3 on 2019 October 1 (T. Kareta et al. 2020) are omitted. The 95% confidence interval windows for the production rate ratios are shown as light gray dashed lines and are predicted for post-outburst dates by extrapolating the pre-outburst values.
Other Images in This Article
Show More
Copyright and Terms & Conditions
© 2026. The Author(s). Published by the American Astronomical Society.