Image Details
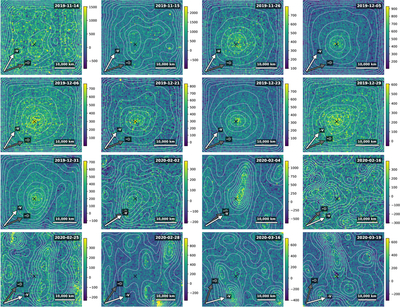
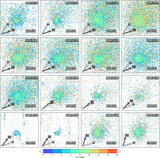
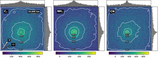
Caption: Figure 12.
C2 emission maps. Each image is centered on 2I (black cross) and displayed with a linear stretch over a zscale interval. Contour lines mark regions of equal flux and highlight when 2I was discernible above the flux of background stars for the specific wavelength range (see Table 2). North is up, east is to the left, and the antisolar (-⊙) and negative velocity (−V) directions are shown with the respective arrows. The clustering of contours near the image borders is because not all exposures span the entire frame once 2I is in the center, caused by the dithering in the imaging technique, resulting in fewer frames contributing to the coadd along the borders.
Other Images in This Article
Show More
Copyright and Terms & Conditions
© 2026. The Author(s). Published by the American Astronomical Society.