Image Details
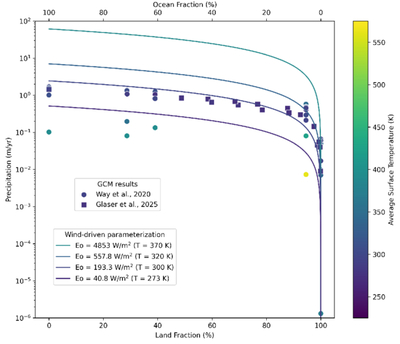
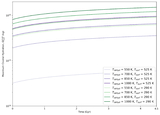
Caption: Figure 2.
Precipitation estimated analytically for different surface temperatures assuming wind-driven evaporation limits (lines, R. T. Pierrehumbert 2010) is compared to the weighted average of precipitation from GCM runs of arid planets (dots, M. J. Way & A. D. Del Genio (2020; and square markers, D. M. Glaser et al. 2025). The average surface temperature associated with the calculated wind-driven precipitation and the GCM outputs are represented by a color heatmap. The M. J. Way & A. D. Del Genio (2020) GCM models tested five discrete land fractions, resulting in the five distinct dot groups. Broadly speaking the analytic precipitation-limited estimate of precipitation agrees with or overestimates precipitation from the GCMs.
Other Images in This Article
Show More
Copyright and Terms & Conditions
© 2026. The Author(s). Published by the American Astronomical Society.