Image Details
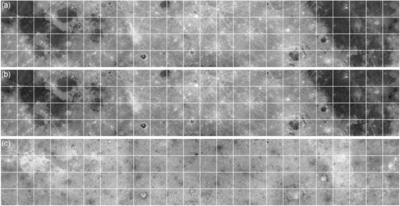
Caption: Figure 7.
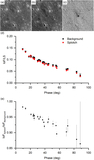
Modeled reflectance maps of the lunar surface observed at (a) i = 30°, e = 0°, and g = 30° and (b) i = 60°, e = 0°, and g = 60° derived using an empirical photometric function (Equation (2)) and the dense WAC photometric library (e.g., Figure 6). (c) Phase angle ratio image created by dividing (a) by (b). Each map spans 0° to 360° in longitude and ±30° in latitude with graticules set at 15° intervals.
Other Images in This Article
Show More
Copyright and Terms & Conditions
© 2026. The Author(s). Published by the American Astronomical Society.
Copyright ©
2026 Astronomy Image Explorer. All Rights Reserved.