Image Details
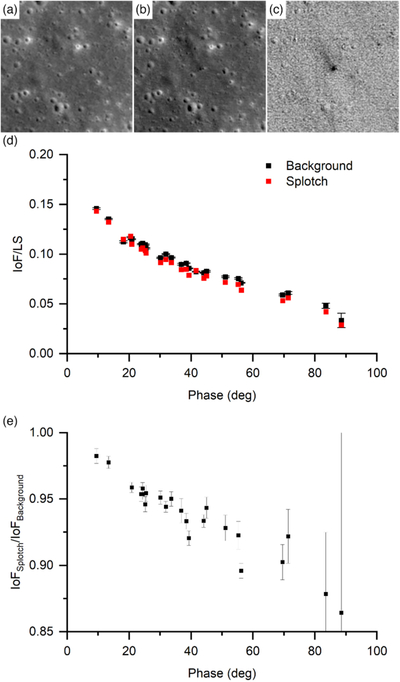
Caption: Figure 9.
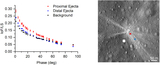
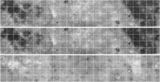
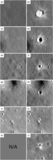
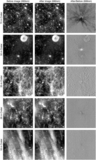
Representative lower-reflectance splotch around the 2013 March 17 impact crater and associated phase response compared to the surrounding regolith. (a) Before image (LROC NAC M183689789L). (b) After image (LROC NAC M1129645568L). (c) Ratio derived by dividing the after image by the before observation. Each frame is 150 m wide. (d) Phase curve of the splotch vs. the surrounding regolith. (e) The ratio of the reflectance of the splotch vs. the reflectance of the background regolith. This plot shows that the contrast of the splotch increases with phase angle, and a splotch may not be detectable at low phase angles (near 0°). The splotch was sampled at 20.7374 °N, 335.6440 °E, and the background was sampled between 20.7379 °N and 20.7384 °N and 335.6449 °E and 335.6460 °E from the March 17 impact photometry site (NAC_PHO_E207N3357).
Other Images in This Article
Show More
Copyright and Terms & Conditions
© 2026. The Author(s). Published by the American Astronomical Society.