Image Details
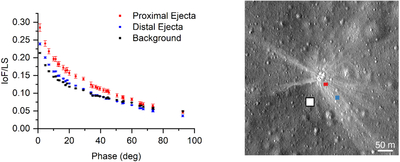
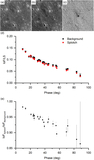
Caption: Figure 4.
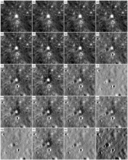
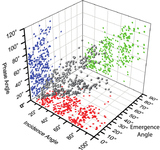
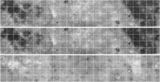
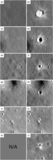
Phase curves of three regions around the Apollo 15 S-IVB impact derived from 49 LROC NAC pairs with a corresponding map showing the sampling locations. The phase curve illustrates that the distal ejecta have a higher reflectance than the background regolith at lower phase angles (<20°), but this trend reverses at higher phase angles (>60°).
Other Images in This Article
Show More
Copyright and Terms & Conditions
© 2026. The Author(s). Published by the American Astronomical Society.
Copyright ©
2026 Astronomy Image Explorer. All Rights Reserved.