Image Details
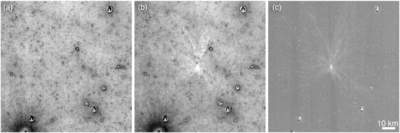
Caption: Figure 14.
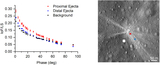
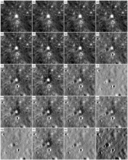
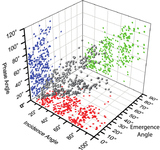
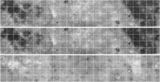
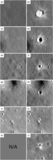
WAC phase angle ratio maps of the region where the 70 m diameter crater formed (centered at 22.352 °S, 320.270 °E). These ratios are created by creating two normalized mosaics at i = 30°, e = 0°, and g = 30°, as well as at i = 60°, e = 0°, and g = 60°. (a) The 30°/60° phase angle ratio was derived from observations before the impact. (b) The 30°/60° phase angle ratio was derived from postimpact observations. (c) The ratio of maps shown in (a) and (b) highlights the change in phase curve slope due to the impact event.
Other Images in This Article
Show More
Copyright and Terms & Conditions
© 2026. The Author(s). Published by the American Astronomical Society.
Copyright ©
2026 Astronomy Image Explorer. All Rights Reserved.