Image Details
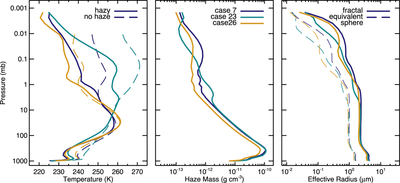
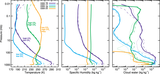
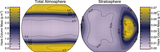
Caption: Figure 7.
Vertical profiles of temperature, haze mass, and haze effective radii for our three hazy cases (7, 23, 26). In the left panel, dashed lines indicate the temperature profile when no haze is assumed to form and with all else being equal. In the right panel, solid lines show the fractal aggregate radii and dashed lines show the radii if each aggregate were condensed into a solid sphere.
Other Images in This Article
Show More
Copyright and Terms & Conditions
© 2025. The Author(s). Published by the American Astronomical Society.
Copyright ©
2025 Astronomy Image Explorer. All Rights Reserved.