Image Details
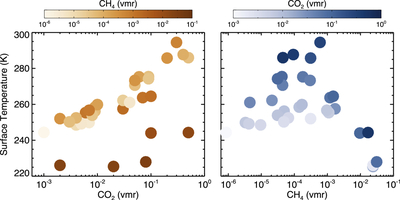
Caption: Figure 3.
The left panel plots the global mean surface temperature vs. CO2 mixing ratio for all 32 ExoCAM simulations. Circles are color-coded via their CH4 mixing ratio. The right panel similarly shows the global mean temperatures, but plotted vs. CH4 on the x-axis and with circles color-coded by the CO2 mixing ratio.
Other Images in This Article
Show More
Copyright and Terms & Conditions
© 2025. The Author(s). Published by the American Astronomical Society.
Copyright ©
2025 Astronomy Image Explorer. All Rights Reserved.