Image Details
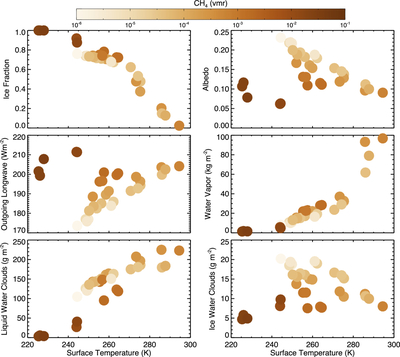
Caption: Figure 4.
Each panel shows global mean climate quantities plotted against the global mean surface temperature on the x-axis, with data points color-coded by the CH4 volume mixing ratio. While quantities generally display dependencies that can be linked to the surface temperature, high-CH4 cases are outliers.
Other Images in This Article
Show More
Copyright and Terms & Conditions
© 2025. The Author(s). Published by the American Astronomical Society.
Copyright ©
2025 Astronomy Image Explorer. All Rights Reserved.