Image Details
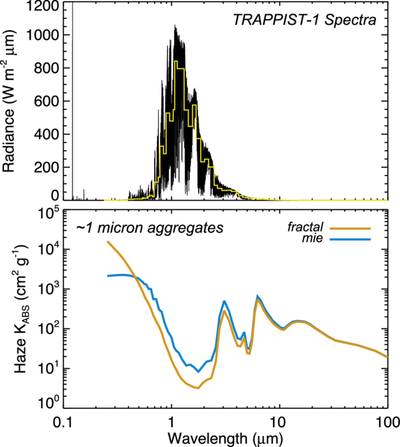
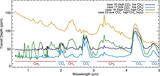
Caption: Figure 8.
The TRAPPIST-1 spectral energy distribution (top panel) compared against the haze mass absorption coefficient for a ∼1 μm particle (bottom panel). The light-yellow histogram in the top panel shows the GCM gridded stellar spectrum. The bottom panel illustrates differences between the optical properties of fractal aggregates vs. equivalent-mass Mie particles.
Other Images in This Article
Show More
Copyright and Terms & Conditions
© 2025. The Author(s). Published by the American Astronomical Society.
Copyright ©
2025 Astronomy Image Explorer. All Rights Reserved.