

Image Details
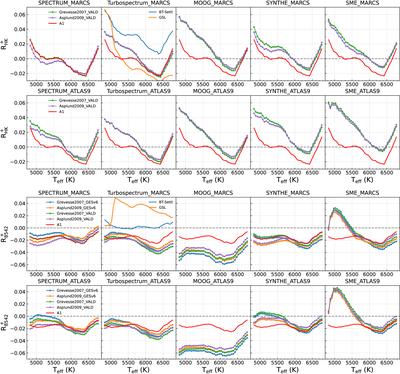
Caption: Figure 17.
Shown here are the 5th percentile curves of ﹩{R}_{{\rm{HK}}}^{+}﹩ and ﹩{R}_{8542}^{+}﹩ for the LAMOST solar-like sample. The upper two rows show ﹩{R}_{{\rm{HK}}}^{+}﹩, and the lower two rows show ﹩{R}_{8542}^{+}﹩. In each panel, the title lists the radiative transfer code and model atmosphere, while the colors distinguish the combinations of solar abundance scale and line list. Each curve corresponds to a different synthesis configuration. The A1 5th percentile curve is shown as a red solid line and is included in all panels for reference. For visual clarity, the BT-Settl and GSL curves are shifted upward by 0.025 in ﹩{R}_{{\rm{HK}}}^{+}﹩ and by 0.1 in ﹩{R}_{8542}^{+}﹩, respectively.
Other Images in This Article
Show More
Copyright and Terms & Conditions
© 2026. The Author(s). Published by the American Astronomical Society.

