

Image Details
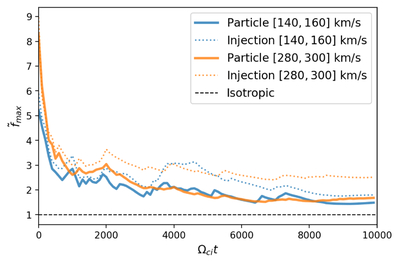
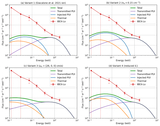
Caption: Figure 8.
The maximum distribution from the simulation compared to the injection and the isotropic distribution, ﹩{\tilde{f}}_{{\rm{\max }}}﹩, as a function of simulation time. The corresponding radial distance is shown on the top axis.
Other Images in This Article
Copyright and Terms & Conditions
© 2026. The Author(s). Published by the American Astronomical Society.

Copyright ©
2026 Astronomy Image Explorer. All Rights Reserved.
