

Image Details
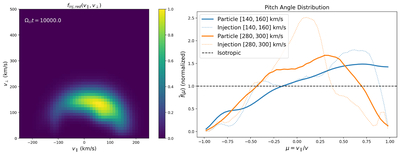
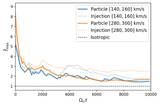
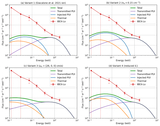
Caption: Figure 7.
Left: injected pickup ion distribution (reduced in v∥, v⊥ and normalized to its maximum value) at the end of the hybrid simulation. Right: distribution in pitch-angle cosine μ, normalized to the isotropic distribution. The solid lines represent the particle distributions at the end of the hybrid simulation, and the dotted lines represent the injected distribution before scattering (corresponding to the left panel of Figure 4). Two velocity bands are considered, as labeled by different colors.
Other Images in This Article
Copyright and Terms & Conditions
© 2026. The Author(s). Published by the American Astronomical Society.

Copyright ©
2026 Astronomy Image Explorer. All Rights Reserved.
