

Image Details
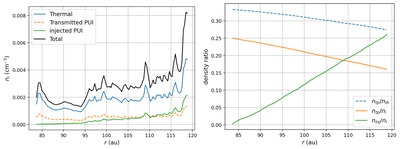
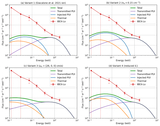
Caption: Figure 2.
Left: densities of the thermal ions (blue), transmitted pickup ions (orange dashed), and injected pickup ions (green) as functions of radial distance r. The total ion density is plotted as the black line. Right: density ratios between transmitted pickup ions and thermal ions ntp/nth (blue dashed), between transmitted pickup ions and total ions ntp/ni (orange), and between injected pickup ions and total ions ninj/ni (green).
Other Images in This Article
Copyright and Terms & Conditions
© 2026. The Author(s). Published by the American Astronomical Society.

Copyright ©
2026 Astronomy Image Explorer. All Rights Reserved.
