

Image Details
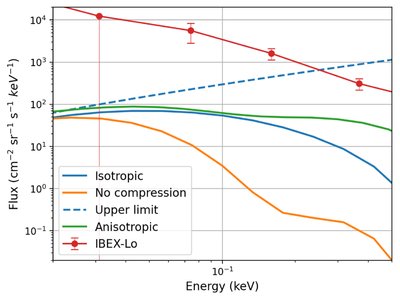
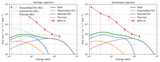
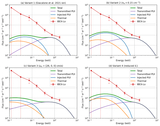
Caption: Figure 6.
Low-energy ENA fluxes from injected pickup ions with different assumptions. The blue line assumes isotropic injection (same as Figure 5, left panel). The green line uses anisotropic injection (same as Figure 5, right panel). The orange line assumes isotropic injection without compressional heating. The blue dashed line is an upper limit based on the peaks of the isotropic distributions.
Other Images in This Article
Copyright and Terms & Conditions
© 2026. The Author(s). Published by the American Astronomical Society.

Copyright ©
2026 Astronomy Image Explorer. All Rights Reserved.
