

Image Details
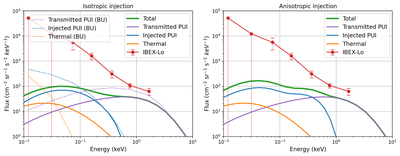
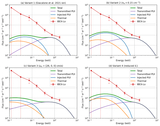
Caption: Figure 5.
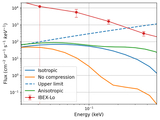
Modeled ENA fluxes based on Voyager 2 data compared with IBEX observations. The left panel shows the results with isotropic injection, and the right panel shows the results with anisotropic injection. The Boston model results are plotted as the dashed lines on the left panel.
Other Images in This Article
Copyright and Terms & Conditions
© 2026. The Author(s). Published by the American Astronomical Society.

Copyright ©
2026 Astronomy Image Explorer. All Rights Reserved.
