

Image Details
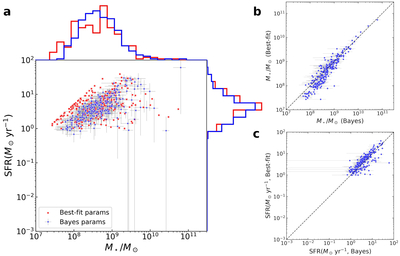
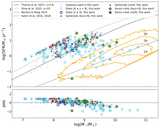
Caption: Figure A1.
A comparison of best-fit and Bayesian galaxy stellar masses and star formation rates derived from SED modeling using CIGALE. (a) Galaxy main-sequence plot of our sample. Red squares denote the best-fit parameters, while blue circles with gray error bars represent the Bayesian estimates and their associated 1σ uncertainties. The corresponding distributions of stellar mass and SFR for both methods are shown by the histograms, with the same color coding, along the top and right axes, respectively. (b), (c) A comparison of the best-fit and Bayesian stellar-mass and SFR estimates. The dashed lines indicate the one-to-one relation.
Other Images in This Article
Copyright and Terms & Conditions
© 2026. The Author(s). Published by the American Astronomical Society.

