

Image Details
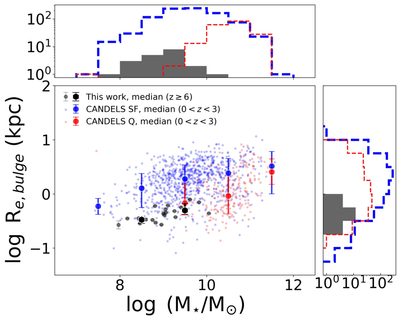
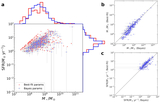
Caption: Figure 6.
The rest-frame optical Re, bulge-to-total stellar-mass trends for the two-component galaxies. The gray (and black) hexagons show the Re, bulge (and median values), of galaxies identified with two-component structures in this work. The blue and red points represent the sizes of bulges in CANDELS galaxies and their corresponding median values for SF and quiescent (Q) galaxies at 0 < z < 3, respectively. The upper and right panels show the distributions of stellar mass and Re, bulge, respectively. The gray histograms correspond to the galaxies from this work, while the blue-dashed and red-dotted histograms represent the CANDELS SF and quiescent populations. The error bars on median values denote the 16th and 84th percentiles of the distribution within each stellar-mass bin.
Other Images in This Article
Copyright and Terms & Conditions
© 2026. The Author(s). Published by the American Astronomical Society.

