

Image Details
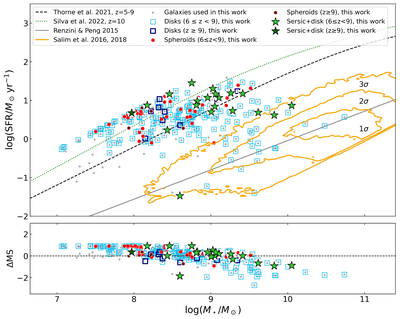
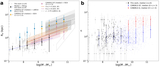
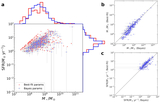
Caption: Figure 8.
The galaxy MS and ΔMS for the sample and comparison with local star-forming galaxies. The morphological information is based on rest-frame B-band emission for our sample and Sloan Digital Sky Survey (SDSS)-g band for local galaxies. The yellow contours represent the distribution of the local SDSS star-forming galaxies from S. Salim et al. (2016, 2018), showing the 1σ, 2σ, and 3σ regions. Different main-sequence relations obtained from observations and predicted from simulations are shown by different curves. Black-dashed curve represents the observed main-sequence relation for high-z galaxies from J. E. Thorne et al. (2021). The green-dotted curve represents the predicted relation for high-z galaxies from the FLARES-JWST simulations (J. C. J. D’Silva et al. 2023). The solid gray curve represents the observed relation in the local Universe (A. Renzini & Y.-j. Peng 2015).
Other Images in This Article
Copyright and Terms & Conditions
© 2026. The Author(s). Published by the American Astronomical Society.

