

Image Details
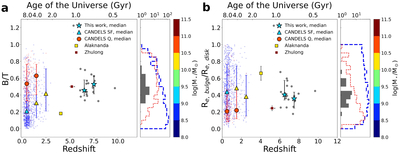
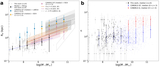
Caption: Figure 7.
The evolution of bulge-to-total light ratio (B/T, panel (a)) and bulge-to-disk size ratio (Re, bulge/Re, disk, panel (b)) with redshift. The gray hexagons are the galaxies in this study. The CANDELS SF and quiescent (Q) galaxies are represented by blue and red data points, respectively. The redshift-binned median values are shown as stars (this work), triangles (CANDELS SF), and circles (CANDELS Q), and are color coded according to the median stellar mass of each redshift bin. The error bars on the median values denote the 16th and 84th percentiles of the distribution within each redshift bin. We plot the recently discovered grand-design spirals—Alaknanda (R. Jain & Y. Wadadekar 2025) and Zhulong (M. Xiao et al. 2025), color coded by their stellar masses, for comparison. Histograms of B/T and Re, bulge/Re, disk are shown on the right of their respective scatter plots.
Other Images in This Article
Copyright and Terms & Conditions
© 2026. The Author(s). Published by the American Astronomical Society.

