

Image Details
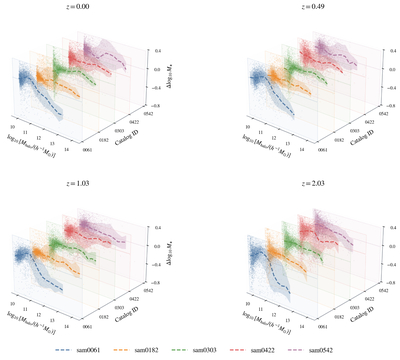
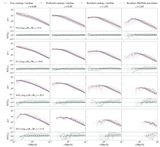
Caption: Figure B1.
Residuals of the stellar-mass prediction for individual galaxies as a function of halo mass for five test SAM catalogs at four redshifts. Dashed curves and shaded regions show the median and 16th–84th percentile range within each halo-mass bin. For visual clarity, the displayed points are randomly subsampled, while the summary curves use all available galaxies.
Other Images in This Article
Show More
Copyright and Terms & Conditions
© 2026. The Author(s). Published by the American Astronomical Society.

Copyright ©
2026 Astronomy Image Explorer. All Rights Reserved.
