

Image Details
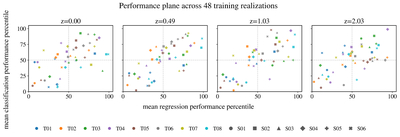
Caption: Figure A1.
Regression–classification performance plane for the 48 individual SAM-group/tree-chunk realizations at four representative redshifts. Colors identify tree chunks and symbols identify SAM groups. Both coordinates are percentile ranks normalized to 0–100 within the 48 realizations, with 100 denoting the best relative performance. These coordinates show relative ordering rather than the absolute size of the differences: at z = 0, for example, the stellar-mass scatter varies only from 0.223 to 0.231, indicating that there is no substantial variations across these individual realizations.
Other Images in This Article
Show More
Copyright and Terms & Conditions
© 2026. The Author(s). Published by the American Astronomical Society.

Copyright ©
2026 Astronomy Image Explorer. All Rights Reserved.
