

Image Details
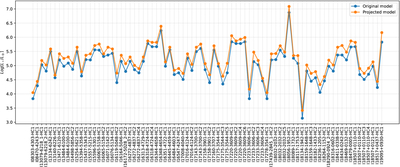
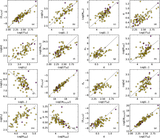
Caption: Figure A1.
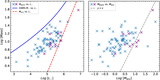
Comparison of protostellar luminosities derived using the original RADMC-3D model (Figure 1 solid lines) and the projection-corrected model (Figure 1 dashed lines) for all cores. The orange points/lines indicate the projection-corrected model, while the blue points/lines indicate the original model.
Other Images in This Article
Show More
Copyright and Terms & Conditions
© 2026. The Author(s). Published by the American Astronomical Society.

Copyright ©
2026 Astronomy Image Explorer. All Rights Reserved.
