

Image Details
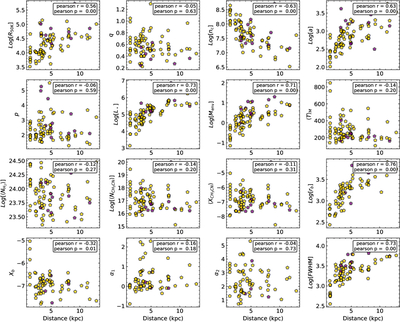
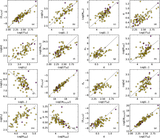
Caption: Figure B2.
Scatter plots showing the relationships between distance and the physical quantities shown in Figure 5. The Pearson correlation coefficients and corresponding p-values are labeled in the top left corner of each panel. An additional physical quantity, the core size (FWHM﹩=\sqrt{{\theta }_{{\rm{mag}}}{\theta }_{{\rm{\min }}}}﹩, where θmag and ﹩{\theta }_{{\rm{\min }}}﹩ are listed in Table E1), is displayed in the last panel.
Other Images in This Article
Show More
Copyright and Terms & Conditions
© 2026. The Author(s). Published by the American Astronomical Society.

Copyright ©
2026 Astronomy Image Explorer. All Rights Reserved.
