Image Details
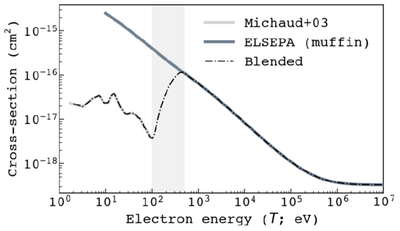
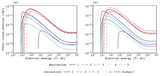
Caption: Figure 1.
Total cross sections (TCSs) for elastic scattering. The light gray curve shows the 1–100 eV measurements of M. Michaud et al. (2003). The slate gray curve shows the cross sections of the ELSEPA model for liquid water. The dashed black curve shows the blended elastic model adopted in Geant4-IcyMoons.
Other Images in This Article
Show More
Copyright and Terms & Conditions
© 2026. The Author(s). Published by the American Astronomical Society.
Copyright ©
2026 Astronomy Image Explorer. All Rights Reserved.