Image Details
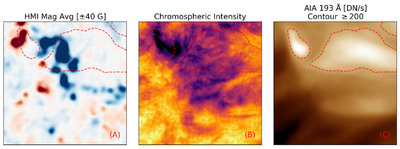
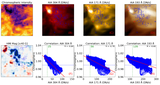
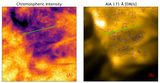
Caption: Figure 8.
(A) The HMI magnetogram. (B) The He I 10830 Å chromospheric signal. (C) The AIA 193 Å image. The red dashed line outlines the regions where the 193 Å intensity is greater than 200 DN s−1, representing the strongly heated regions observed in the 193 Å band.
Other Images in This Article
Show More
Copyright and Terms & Conditions
© 2026. The Author(s). Published by the American Astronomical Society.
Copyright ©
2026 Astronomy Image Explorer. All Rights Reserved.