Image Details
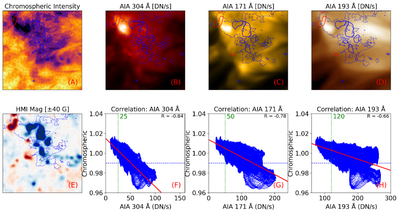
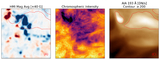
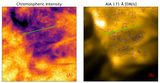
Caption: Figure 7.
The images used in this figure are 45 minute time-averaged data. (A) The He I 10830 Å chromospheric signal. (B)–(D) AIA band images at 304 Å, 171 Å, and 193 Å, respectively. (E) The HMI magnetogram. (F)–(H) Scatter plots and linear relationships between the three EUV bands and the He I 10830 Å chromospheric signal. Legend details: in panels (A)–(E), the blue dashed line outlines the strong absorption region, defined as the 99% percentile of the time-averaged He I 10830 Å chromospheric signal; the red and blue solid lines represent the magnetic field contours of ±40 G. In panels (F)–(H), data points below the blue dashed line correspond to the strong absorption region, and the green dashed line shows the minimum EUV brightness within this region.
Other Images in This Article
Show More
Copyright and Terms & Conditions
© 2026. The Author(s). Published by the American Astronomical Society.