Image Details
Caption: Figure 5.
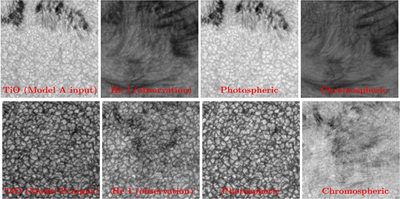
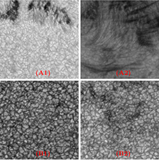
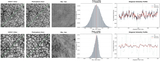
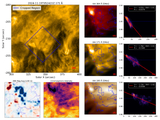
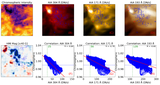
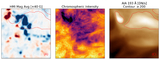
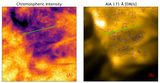
Comparison of photospheric and chromospheric components. The first row shows the AR; the second row shows the quiet region. Columns (1)–(2) display the original TiO and He I 10830 Å observations; columns (3)–(4) present the generated photospheric reference and extracted chromospheric absorption maps. All images have a spatial size of 400 × 400 pixels. Animations of the aligned sequences are available online for the AR (300 × 300 pixel, 3 s) and QS (400 × 400 pixel, 4 s) regions. These animations cover ∼40–45 minutes of solar evolution, highlighting the dynamic chromospheric fibrils (column (4)) isolated from the composite signals (column (2)).
(An animation of this figure is available in the online article.)
(An animation of this figure is available.)
The video/animation of this figure is available in the online journal.
Other Images in This Article
Show More
Copyright and Terms & Conditions
© 2026. The Author(s). Published by the American Astronomical Society.