Image Details
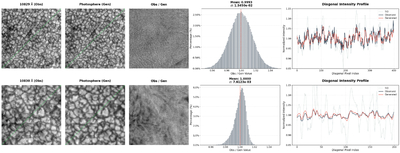
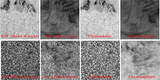
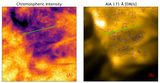
Caption: Figure 4.
Testing cases of our proposed models: the top row displays results from Model A for ARs, and the bottom row shows results from Model B for the QS. The columns from left to right represent (1) the observed intensity used as the training label (Obs); (2) the predicted 10830 Å photospheric signal generated by the model (Gen); (3) the ratio map indicating relative deviations (Obs/Gen); (4) the distribution of the Obs/Gen values representing the model’s prediction accuracy; and (5) the intensity values of pixels sampled along the diagonal from the bottom left to the top right of the images.
Other Images in This Article
Show More
Copyright and Terms & Conditions
© 2026. The Author(s). Published by the American Astronomical Society.
Copyright ©
2026 Astronomy Image Explorer. All Rights Reserved.