Image Details
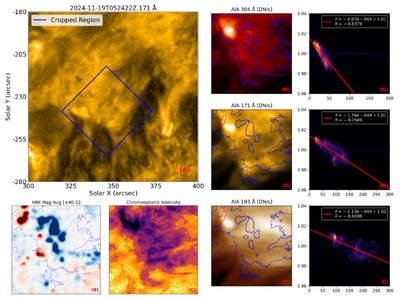
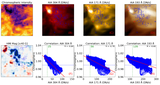
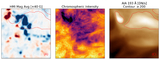
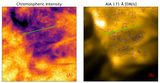
Caption: Figure 6.
Multiwavelength observations and quantitative analysis of the quiet-Sun region. The images used in this figure are 45 minute time-averaged data. (A) SDO/AIA 171 Å image, with the blue box indicating the area of interest for this study; (B) HMI magnetogram; (C) chromospheric structure separated from the He I 10830 Å line; (D)–(F) 304, 171, and 193 Å observations within the study region; (G)–(I) scatter plots and linear fitting relationships, where the x-axis represents the intensity of the three AIA bands (AIA 304, 171, 193 Å), and the y-axis represents the He I 10830 Å chromospheric signal. Legend details: in panels (B)–(F), the blue dashed line represents the contour of the time-averaged mean intensity of the He I 10830 Å data, with the area inside the dashed line denoting the He I 10830 Å absorption region; the red solid line and the blue solid line denote the magnetic field contours of positive 40 G and negative 40 G, respectively.
Other Images in This Article
Show More
Copyright and Terms & Conditions
© 2026. The Author(s). Published by the American Astronomical Society.