

Image Details
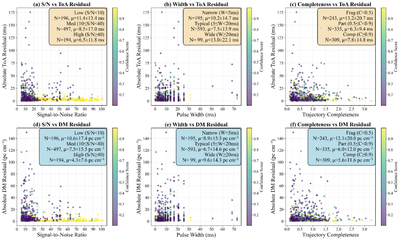
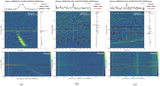
Caption: Figure 7.
Error correlation with observational parameters. Scatter plots show absolute ToA residuals (top row: (a)–(c)) and DM residuals (bottom row: (d)–(f)) versus S/N (left column), pulse width (middle column), and trajectory completeness (right column). Points are color coded by detection confidence scores.
Other Images in This Article
Copyright and Terms & Conditions
© 2026. The Author(s). Published by the American Astronomical Society.

Copyright ©
2026 Astronomy Image Explorer. All Rights Reserved.
