

Image Details
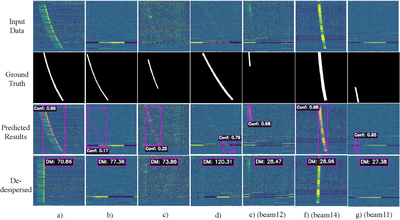
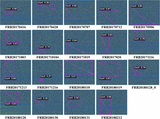
Caption: Figure 2.
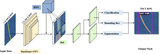
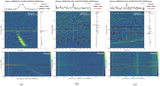
Visualization of key stages in the FRTSearch pipeline using seven representative examples (resized to 256 × 256). Columns (a)–(d): four distinct FRT sources exhibiting varied dispersive features. Columns (e)–(g): pulsar B0820+02 observed simultaneously by three adjacent FAST receiver beams, demonstrating signal variation. Row 1: preprocessed time–frequency dynamic spectra (model input). Row 2: manually annotated ground-truth masks for training. Row 3: Mask R-CNN predictions displaying segmentation masks (pink contours), bounding boxes (pink rectangles), and confidence scores. Row 4: dedispersed dynamic spectra with IMPIC-inferred DM values.
Other Images in This Article
Copyright and Terms & Conditions
© 2026. The Author(s). Published by the American Astronomical Society.

