

Image Details
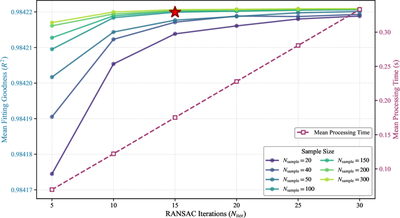
Caption: Figure 6.
Evaluation of IMPIC hyperparameters. The plot compares the mean R2 score (left axis, solid lines) and processing time (right axis, dashed line) across different sample sizes (Nsample) and iterations (Niter). The red star highlights the adopted configuration (Nsample = 100, Niter = 15) used in this work.
Other Images in This Article
Copyright and Terms & Conditions
© 2026. The Author(s). Published by the American Astronomical Society.

Copyright ©
2026 Astronomy Image Explorer. All Rights Reserved.
