

Image Details
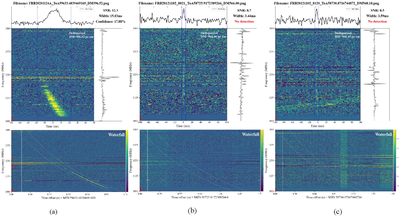
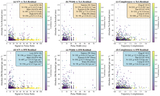
Caption: Figure 8.
Diagnostic plots for three representative candidates. Each column displays: (top) dedispersed pulse profile with on-pulse region (vertical dotted lines) and metadata; (middle) dedispersed dynamic spectrum with frequency-averaged bandpass (right); (bottom) dispersed dynamic spectrum showing frequency-time trajectory. (a) Candidate using IMPIC-inferred parameters. (b)–(c) FRB 20121102 (missed by FRTSearch) using parameters provided by FAST-FREX (X. Guo et al. 2025).
Other Images in This Article
Copyright and Terms & Conditions
© 2026. The Author(s). Published by the American Astronomical Society.

Copyright ©
2026 Astronomy Image Explorer. All Rights Reserved.
