

Image Details
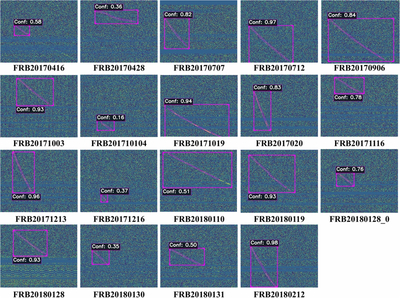
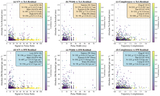
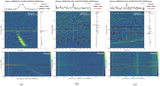
Caption: Figure 9.
FRTSearch detection results on 19 ASKAP FRBs (R. M. Shannon et al. 2018). The panels show time–frequency spectra (336 × 336 pixels) with overlaid model predictions: segmentation masks (pink contours), bounding boxes (pink rectangles), and confidence scores (white text).
Other Images in This Article
Copyright and Terms & Conditions
© 2026. The Author(s). Published by the American Astronomical Society.

Copyright ©
2026 Astronomy Image Explorer. All Rights Reserved.
