Image Details

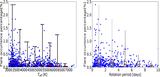
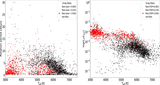
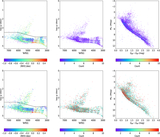
Caption: Figure 20.
The relationship between LX/Lbol and R0. The color bar represents BP – RP. The black line shows the broken power-law fit. The left panel corresponds to the low-resolution data, and the right panel corresponds to the medium-resolution data.
Other Images in This Article
Show More
Copyright and Terms & Conditions
© 2026. The Author(s). Published by the American Astronomical Society.
Copyright ©
2026 Astronomy Image Explorer. All Rights Reserved.