Image Details
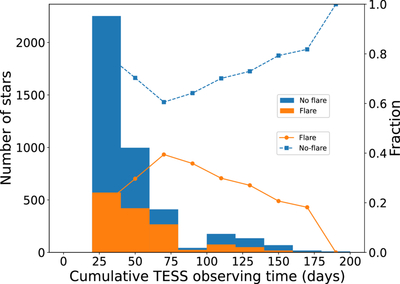
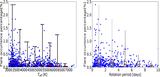
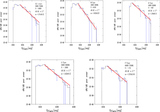
Caption: Figure 15.
Distribution of the cumulative TESS observing time for stars in our sample. The histograms show the number of stars in each 20 day bin for flare stars (orange) and nonflare stars (blue). The overplotted lines represent the fractions of flare and nonflare stars as a function of cumulative observing time.
Other Images in This Article
Show More
Copyright and Terms & Conditions
© 2026. The Author(s). Published by the American Astronomical Society.
Copyright ©
2026 Astronomy Image Explorer. All Rights Reserved.