Image Details
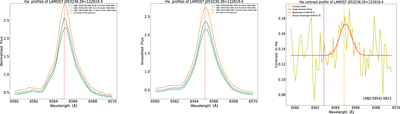
Caption: Figure 14.
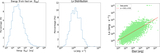
Example of an Hα line asymmetry. From left to right, the panels present the normalized and smoothed Hα profiles, followed by the single Gaussian fitting results for the Hα contrast profile of the active spectrum. The corresponding object is labeled as LAMOST J053236.39+122619.4. In the legend, LMJD, SNR, and Hα peak positions are provided, with the peak position of the first spectrum marked by a red dashed line. The solid yellow line denotes the Hα contrast profile, whereas the solid red line illustrates the single Gaussian fitting result. The vertical dotted red and orange lines indicate the wavelengths of the Hα line at 6562.85 Å and the vacuum wavelength at 6564.61 Å, respectively.
Other Images in This Article


Show More
Copyright and Terms & Conditions
© 2026. The Author(s). Published by the American Astronomical Society.