Image Details
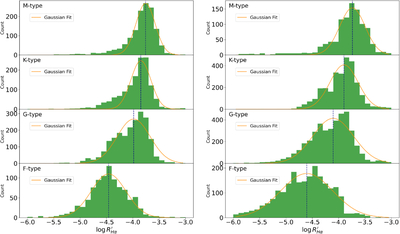
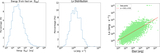
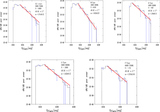
Caption: Figure 12.
Statistical histograms for ﹩\mathrm{log}R{{\prime} }_{{\rm{H}}\alpha }﹩ across various spectral types are presented, with low-resolution data on the left and medium-resolution data on the right. Gaussian fit results are represented by the solid orange line, and the x-axis values corresponding to the peaks of the Gaussian fit are indicated by the dashed blue line.
Other Images in This Article
Show More
Copyright and Terms & Conditions
© 2026. The Author(s). Published by the American Astronomical Society.
Copyright ©
2026 Astronomy Image Explorer. All Rights Reserved.