Image Details
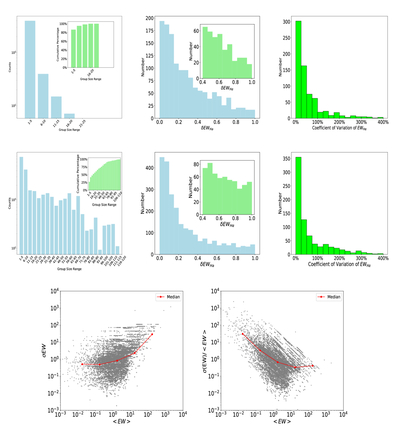
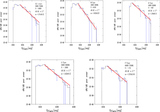
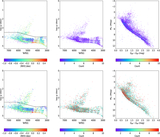
Caption: Figure 11.
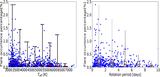
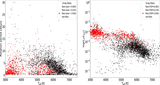
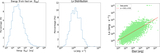
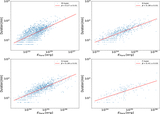
In the upper set of plots, the top left panel features an exposure count histogram, with a subplot presenting a cumulative bar chart of exposure counts. The top middle panel displays a δEWHα histogram, accompanied by a subplot showing an enlarged view of the region where δEWHα exceeds 0.4. The top right panel shows a histogram of the coefficient of variation for EWHα. Mirroring the layout and structure of the upper plots, the lower set utilizes medium-resolution data instead of low-resolution data. The third set of plots, also based on the medium-resolution sample, presents the relationships between the mean EWHα (〈EW〉) and its standard deviation (σEW) in the left panel, and between 〈EW〉 and σEW/〈EW〉 in the right panel. The red dots represent the median values within each bin.
Other Images in This Article
Show More
Copyright and Terms & Conditions
© 2026. The Author(s). Published by the American Astronomical Society.