Image Details
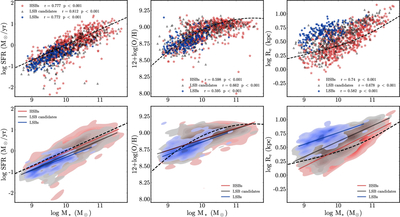
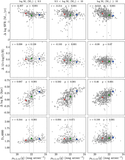
Caption: Figure 4.
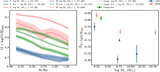
Relationship between stellar mass and SFR, 12 + log(O/H), and size. The first row presents scatterplots, while the second row displays number density contours. Blue circles and contours represent LSB galaxies, hollow triangles and gray contours denote LSB candidates, while red stars and contours indicate HSB galaxies. In the left panel, the black dashed line depicts the star formation main sequence (SFMS) derived from MaNGA data (F. Belfiore et al. 2018). The black dashed line in the median panel illustrates the mass–metallicity relationship for star-forming galaxies presented by C. A. Tremonti et al. (2004). In the right panel, the black dashed lines represent the mass–size relation for late-type galaxies based on SDSS data (S. Shen et al. 2003). In the second row, the blue, gray, and red solid lines represent the quantile regression lines for LSB galaxies, LSB candidates, and HSB galaxies at q = 0.5, respectively. Meanwhile, in the legend of each graph, we also present the r and the p-value for each sample provided by Spearman rank correlation.
Other Images in This Article
Show More
Copyright and Terms & Conditions
© 2026. The Author(s). Published by the American Astronomical Society.