Image Details
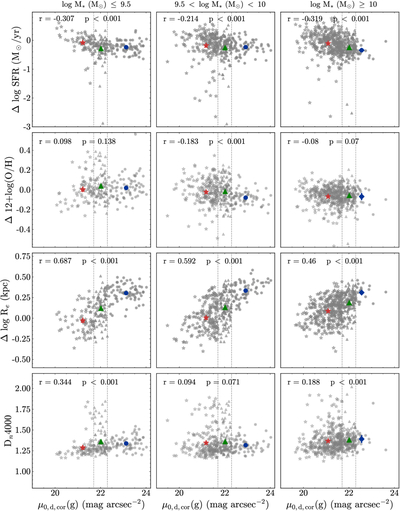
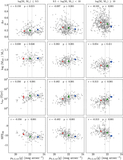
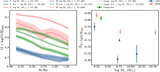
Caption: Figure 5.
The residuals of key galaxy parameters (SFR: Δlog(SFR); gas-phase metallicity: Δ12 + log(O/H); and effective radius: Δlog(Re))—calculated relative to correlations from reference galaxy samples—along with Dn4000 values, plotted against the corrected disk central surface brightness (μ0,d,cor(g)) across three stellar-mass ranges. The first, second, and third columns correspond to galaxies with M* ≤ 109.5 M⊙, 109.5 < M* < 1010 M⊙, and M* ≥ 1010 M⊙, respectively. Gray points (in distinct shapes) denote individual galaxies in this study: circles for LSB galaxies, triangles for LSB candidates, and stars for HSB galaxies. Larger colored symbols (blue circles for LSB galaxies, green triangles for LSB candidates, and red stars for HSB galaxies) represent the weighted averages of each sample. Error bars indicate median measurement uncertainties, while gray dashed lines mark central disk surface brightness boundaries separating HSB, LSB candidates, and LSB galaxies (from left to right). The Pearson correlation coefficients (r) and p-values for all galaxies in each mass range are displayed in the upper left corner of each panel.
Other Images in This Article
Show More
Copyright and Terms & Conditions
© 2026. The Author(s). Published by the American Astronomical Society.