Image Details
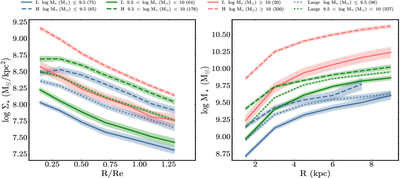
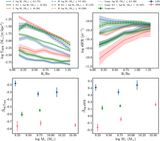
Caption: Figure 7.
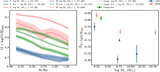
The radial profile of Σ* as a function of R/Re and the cumulative M* as a function of physical radius R in different stellar-mass ranges. Blue, green, and red correspond to the mass ranges ≤109.5, 109.5–1010, and ≥1010 M⊙, respectively. Within each mass range, the solid line represents the median profile of LSB galaxies, the dashed line for HSB galaxies, and the dotted line for large-size galaxies. Shaded areas denote the errors associated with each median profile. The number of LSB and HSB galaxies in each stellar-mass range is listed in the legend.
Other Images in This Article
Show More
Copyright and Terms & Conditions
© 2026. The Author(s). Published by the American Astronomical Society.
Copyright ©
2026 Astronomy Image Explorer. All Rights Reserved.