Image Details
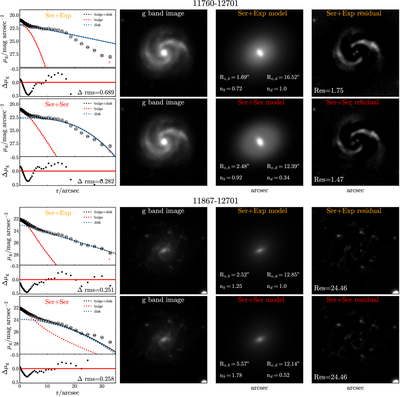
Caption: Figure 1.
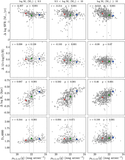
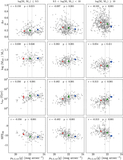
The two-component decomposition results for galaxies 11760–12701 (a bulge-dominated galaxy with spiral arms, upper eight panels) and 11867–12701 (a disk-dominated galaxy with weak spiral arms, lower eight panels). The first and third rows display decomposition results for a Sérsic bulge combined with an exponential disk, while the second and fourth rows show results for a Sérsic bulge combined with a Sérsic disk. The first column presents fitting results for the surface brightness radial profile and corresponding residuals, where black open circles represent the median g-band surface brightness obtained from elliptical isophotal fitting of the galaxies; red and blue dotted lines are the fitting results for the bulge and disk components, respectively, and the black dotted line indicates the fitting result for the total surface brightness of the bulge and disk. All model lines are convolved with the PSF, and the maximum error of the observed data points (red error bar) is labeled in the lower right corner of each panel. The residuals Δμg (black dots) are calculated as the difference between the measured surface brightness (black open circles) and the total surface brightness fitting curve (black dotted line). To guide the eye, the horizontal red line indicates a 0 mag arcsec−2 difference between the fit and data, while the Δrms of the deviation between fit and data is given in the lower right corner. The second column presents g-band images from the DESI survey. The third column shows model images with annotations of Re and Sérsic index n for each component (bulge and disk). The fourth column displays residual images, with the sum of residuals for each image labeled in the lower left corner, and its units are nanomaggies.
Other Images in This Article
Show More
Copyright and Terms & Conditions
© 2026. The Author(s). Published by the American Astronomical Society.